Thursday, May 28, 2009

Super Spike Two

Super Spike Two

Thu, May 28 2009, 06:29 GMT
by Phil Flynn

Alaron


“Super Spike Two” coming to a screen or terminal near you. Is $150 barrel oil going to be cheap in the coming years? Well the kingpin oil minister of the OPEC cartel sure seems to think so.

Saudi Arabia’s oil minister and the most influential member of the OPEC cartel says that he thinks that oil prices could exceed the previous record above $147 a barrel in the next two or three years. The reason is that the current “low” oil price has caused a lack of exploration and capacity expansion. And because of that al Naimi said we will see new record high oil prices within the next two or three years. In a speech in Italy Naimi said that Saudi Arabia is maintaining its long-term focus rather than being swayed by the volatility of short term conditions. However, if others do not begin to invest similarly in new capacity expansion projects, we could see within two to three years another price spike similar or worse than what we witnessed in 2008.

Of course as smart as Al-Naimi is he has not been the best predictor of long term price moves. Still when the man talks it is obvious that the market listens. And because of the wide contango in futures, a phenomena that means that long term futures are priced higher the shorter term delivery dates, the market may have been expecting this future potential price supply squeeze all along. The market has been paying the market place to store oil for that rainy day. And according to some hard rain is soon to fall.

It is not just al-Naimi that is saying it. In fact he is echoing the same concerns that the International Energy Agency raised last week. The IEA warned in a report that falling energy investment was paving the way for a huge oil price surge within three years. They estimate this that because of the recession oil companies and investors have canceled or postponed about $170 billion of investment, equivalent to roughly two million barrels a day in future oil supply. Add to that an additional 4.2 million barrels a day in future oil-supply capacity that has been delayed by at least 18 months. If you put that together, it is over 6 million barrels of daily oil production that we thought we would see come on line that more than likely will come on when it might be too little, too late.

In the short term the oil market is moving on a delicate balance of concerns over inflation mixed in with a rising tide of economic optimism. Oil seemed to forget all about the geo-political risks brought on by North Korea and instead focused on that surging consumer confidence. The oil market continues to react to any semblance of good economic news partly because of the fears of inflation expectations in the back drop of a recovery but also because an economic recovery and a surge in global oil demand will be hard pressed to be met by supply because of the dramatic and continuing drop in oil investment. Oh sure, I know that supply is ample right now and I am not talking about shortages but the market is doing things for a reason. We may need high oil prices to get the type of investment that will be critical to meet the demand needs of the future. If we don’t. it might not just be the high price of oil that hurts the economic recovery but the inability to secure future supply.

Tuesday, May 5, 2009

Trading Volume Separates Bull Markets from Bear Rallies

Trading Volume Separates Bull Markets from Bear Rallies

William Hester, CFA
April 2009
All rights reserved and actively enforced.

Reprint Policy

One of the platitudes most constantly quoted in Wall Street is to the effect that one should never sell a dull market short. That advice is probably right oftener than it is wrong, but it is always wrong in an extended bear swing. In such a swing the tendency is to become dull on rallies and active on declines.

- William Peter Hamilton, The Stock Market Barometer (1909).

Volume tends to expand in the main direction of the trend. In a bull market, advances accompanied by increasing volume or declines on diminishing volume are taken to be bullish. Conversly, in a bear market, declines are accompanied by increasing volume and advances show diminishing volume. Volume should always be studied as a trend (relative to what has preceded).

- Richard Russell, The Dow Theory Today

The bottom is preceded by a period in which the market declines on low volumes and rises on high volumes. The end of a bear market is characterised by a final slump of prices on low trading volumes. Confirmation that the bear trend is over will be rising volumes at the new higher levels after the first rebound in prices.

- Russell Napier, Anatomy of the Bear (his study of the four great stock market bottoms of 1921, 1932, 1949, and 1982).

Whether it was William Peter Hamilton observing the trading activity of the 19th century, or Richard Russell who has studied the market's real-time price and volume action for more than 50 years, or Russell Napier who took the time for an in-depth review of the 4 greatest buying opportunities in the 20th century, each came to a similar conclusion: to confirm a change in market conditons, watch trading volume closely. By this measure, the market's recent rally still has much to prove.

The graphs below attempt to provide visual support to the idea that volume matters as a characteristic of a rally – especially one that is so widely annointed as the beginning of a new bull market. The graphs will hopefully also add to the comments John Hussman has made – including those in last week's Green Shoots over Thin Ice and December's Recogntion, Fear and Revulsion . Specifically, bear markets don't typically end in a crescendo of fear and panic, but more often on a feeling of “despair and disillusionment,” while strong bull markets tend to feature heavy trading volume.

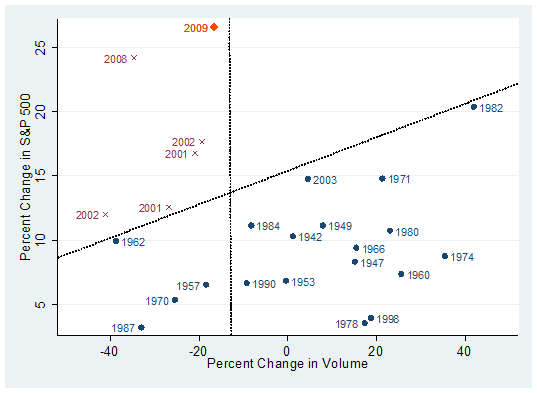
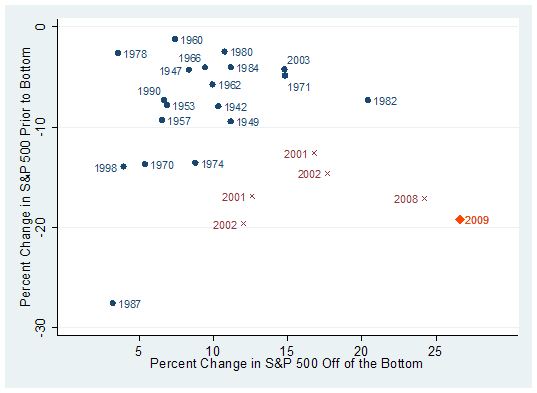
In each of the charts below the blue dates represent the beginning of each bull market since 1940. The red dates represent this decade's bear-market rallies, including 4 during the 2000-2003 bear market and the rally that lasted from November of last year through January.

In the first graph below, the vertical axis shows the 4-week percent change in the S&P 500 beginning a month prior to each trough in the market. It attempts to capture how sharp the final move was to the low. The horizontal axis shows the 5-week change in the S&P 500 off of the bottom. It attempts to measure the intensity of the rally that followed. Data that fall in the upper left portion of the graph represent periods where the market bottomed with little fanfare, and the rally that followed was similiarly uninspiring. Data that fall to the bottom right represent periods where a sharp rally off of the bottom approximated the severity of the preceding decline.

To some extent, all stock market bottoms carve out a ‘V' bottom. Prices move lower, and then change direction. But look at the clump of blue data points in the upper left portion of the graph. These aren't the capitulations that most investors have in their minds when they think of a classic bear-market V-bottom. The bulk of bear markets have ended by falling less than 10 percent in the final month – and were followed by similiarly modest moves off of the bottom. There are exceptions which include 1987 and 1998. But those corrections were sharp and condensed. Even so, they were both followed by tepid rebounds in the initial upswing.

Look at the bear-market rallies in red. The characteristic that these periods share is that they frequently carve out an acute bottom – a capital ‘V' to the typical bear-market bottom's lowercase ‘v'. In each of the 5 cases, a sharp condensed decline created an oversold condition, which was then followed by a similarly powerful rally.

Since it's unknown whether the recent advance is a rally within a bear market or the beginning of a new bull market, the market's performance in 2009 is denoted in orange. It sits far away from the blue data points, and shares its space with the 5 previous bear-market rallies. And while much has been said about the strength of the rally this year, the graph shows that it's consistent with the severity of the decline that preceeded it. The S&P 500 fell 26 percent from it's peak in January to the March low. It's rallied since March by roughly the same amount.

This is not to say that the market never rallies strongly at the beginning of a bull market. During the first weeks of the bull markets beginning in 1971, 1982, and 2003 the market rallied impressively in a short period of time. But an important distinction is that the approach to their final lows was distinguished by a more moderate decline when comapared with each bear market rally.

Missing Volume

The second characteristic of a trustworthy bear-market bottom is that the rally that follows tends to coincide with a healthy increase in volume. The chart below again shows all of the bear-market bottoms since 1940 in blue and the 5 most recent bear-market rallies in red, along with this year's advance. This time the vertical axis measures the 5-week percent change in the S&P 500 from each bottom. The horizontal axis measures the 5-week percent change in NYSE volume (smoothed). The two dotted lines group the data into three separate areas. Data points that fall in the upper left portion of the graph represent powerful rallies on contracting volume. Data points that fall in the lower right portion of the graph represent steadier advances with increasing volume or slightly contracting volume. The lower left portion represents bull-market bottoms that began with contracting volume.

It appears that bear-market rallies like to stick together. Here you can see the characteristics these rallies share include strong (even if temporary) returns with contracting volume. Each had strong returns within the first 5 weeks of the rally - and most went on to gain more than 20 percent before rolling over. But it's important to note that volume waned during each of these rallies. And for the most part, the larger the contraction in volume, the more quickly the rally tended to lose steam.

The characteristics of this year's rally are interesting. It's the strongest 5-week rally over the entire data set – even with contracting volume. One positive we can note is that the volume is contracting on this rally less than it contracted in last year's bear-market advance. But the market has also run up strongly on volume that would be unusually weak for a bull market advance of this size.

You can see what most initial bull advances look like in the lower right part of the graph. Except for 1982 and to a lesser extent 1971 and 2003, bull markets tend not to be explosive in their first couple of weeks. And when they are, the moves tend to coincide with a similarly explosive increase in volume. NYSE volume grew by 40 percent in the first 5 weeks or so off of the 1982 bull market. At an S&P 500 dividend yield of nearly 7%, stocks were cheap and investors showed their conviction.

This is not to say that bear-market bottoms can't occur on low or contracting volume. They can, as is shown in the lower left portion of the graph. The bear-market bottoms of 1957, 1962, 1970, and 1987 all began with unimpressive amounts of volume. But they also share another characteristic – early returns were muted. The bull markets that did begin on low volumes didn't have explosive begininings.

Recruiting Volume

If March 6th proves to be the bottom of the market, Anatomy of the Bear author Russell Napier can put off his next edition for awhile because the most recent bear market won't qualify as a great bottom. That's because even though the market's decline since 2007 has been one of the largest on record, it didn't bring the market to truly great values. In his analysis of the stock market bottoms of 1921, 1932, 1949, and 1982 Mr. Napier chose to use two measures to gauge the valuation of the market. One was Robert Shiller's PE ratio based on trailing earnings. As I noted in Market Valuations During U.S. Recessions , this ratio has fallen to the mid-single digits during periods of extreme undervalution. It's currently 15. The second valuation tool Mr. Napier used was the q-ratio, a measure of market valuation relative to the replacement cost of assets. Deep undervaluation for this measure tends to be when market prices are roughly 35 percent of replacement costs. According to the most recent data the q ratio is about twice that.

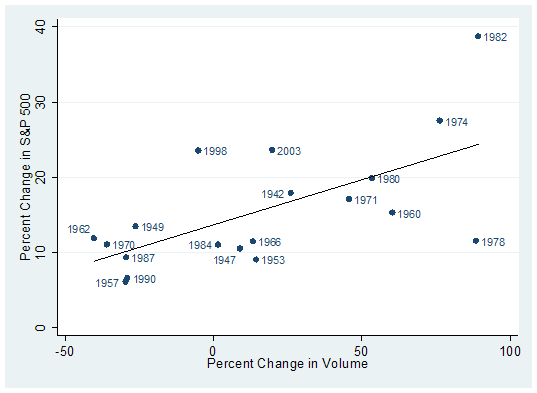
An important observation that Mr. Napier makes in his studies of the most damaging bear markets is that even if the initial move off of the bottom is lacking volume, once a new higher level is reached, the market should begin to attract buying interest. In each of the bottoms he studied, volume expanded noticeably after the intial rally. This idea also holds up for the majority of bear-market bottoms. In the graph below the axes are the same as the graph immediately above. The vertical axis shows the percent change in the S&P 500 while the horizontal axis shows the percent change in volume. But this time the period is 6 months from each bear-market bottom.

The line that fits the data slopes upward, implying that the more robust a rally is during the first six months, the better the improvement in volume. Here the bear-market bottoms of 1982 and 1974 stand out. Both provided strong returns that coincided with equally impressive improvements in volume. The periods of 1974 and 1982 are examples where ‘revulsion' and deep undervaluation can combine to create a powerful base from which bull markets launch from.

Contracting volume is not enough evidence to qualify this is a bear-market rally with certainty. There are other measures that are showing more strength – such as various indicators of market breadth. But new bull markets, whether at their inception or soon after, have a history of recruiting noticeable improvements in volume. So far this rally lacks that important quality. Over the next few weeks stock market volume will be a metric to watch closely. 

Monday, May 4, 2009

Emaar Properties to maintain focus on business segmentation and geographic expansion

Emaar Properties to maintain focus on business segmentation and geographic expansion

• Chairman highlights project delivery as priority at 11th AGM
• Company holds international land bank of 516 million sq metres

Dubai, UAE: The financial results for Emaar Properties PJSC (EMAAR) for the year ending December 31, 2008, were approved by shareholders at the company’s eleventh Annual General Meeting (AGM), held today. At the meeting, it was highlighted that Emaar will continue to build on its strategy of business segmentation and geographic expansion, despite the challenging global business environment.

“Today, the global economic landscape is changing rapidly, and in these challenging times, our strategy of business segmentation and geographic expansion remains central to our business plans,” said Mr. Mohamed Alabbar, Chairman, Emaar Properties, outlining the company’s growth strategy. “We will stay true to the path of growing our new business lines, including shopping malls & retail, hospitality & leisure, education and healthcare.”

Mr. Alabbar said that completion of projects and ensuring timely delivery will be a priority in 2009. “There are several bright spots for the company during 2009. These include the completion and opening of the world’s tallest building Burj Dubai; the scaled-up operations of The Dubai Mall with its full complement of 1,200 stores and unique family entertainment concepts; and the unveiling of The Dubai Fountain in Downtown Burj Dubai. Several projects will move ahead quickly in our international markets, including the handover of homes, offices and industrial land in a number of projects. All these support the company in staying firmly on the growth path,” he explained.

The AGM approved the election of Mr Mohamed Alabbar, Mr Hussain Al Qemzi, Mr Majid Saif Al Ghurair, Mr Ahmad Jamal Jawa, Dr Lowai Mohamed Belhoul, Mr Ahmad Al Matrooshi, Mr Khalifa Al Daboos and Mr Saeed Ahmed Al Tayer, as the Board of Directors of the company.

The meeting also approved the decision not to distribute dividends for 2008 and instead reinvest profits for long-term growth of the company.

Approving the Directors’ Report, Auditor’s Report and financial statements, the AGM appointed Ernst & Young as the Auditors for the year 2009.

One of the world’s leading property developers, Emaar’s current land bank stands at 516 million square metres, with a fair value of AED 79 billion (US$21.64 billion). In 2008, Emaar recorded net operating profits of AED 5.578 billion (US$1.519 billion. Emaar’s annual revenue for 2008 is AED 16.015 billion (US$4.360 billion).

Sunday, May 3, 2009

Global Economics on Tilt – How to Protect Your Ass(ets)

Global Economics on Tilt – How to Protect Your Ass(ets)
Source: Jeff Clark, Casey Research  05/01/2009

Gold isn’t going to $2,000 an ounce.

Before you gag on your coffee or suffer chest pains, allow me to explain.

We’re about eight years into the bull market, and gold has breached the $1,000 level twice and has spent weeks 

trading above the old high of $850. Some observers are now saying that gold’s pretty much had its day and that 

once the recession is over, it will retreat for good.

However, the four-digit gold price we’ve seen so far is with no price inflation to speak of, no effects of the 

atrocious increase in the money supply, and despite a rising dollar. What happens to gold when each of those 

pictures gets turned upside down – high inflation, excess cash jolting the economy, and a falling dollar? 

After all, gold’s performance to date has been powered only by general anxiety, not by any visible erosion in 

the dollar’s value.

I decided to take a fresh look at calculations that could be used to appraise gold’s upside potential. No one 

of them, by itself, comes with compelling logic. But they all point in the same direction.

Gold’s Percentage Rise in the Last Bull Market. What if gold in this bull market repeats the percentage rise 

in the last bull market? In the 1970s gold rose from $35 to $850, a factor of 24.28. Our low in 2001 was 

$255.95. Multiply that by 24.28 and you get a gold price of $6,214 per ounce.

U.S. Gold Holdings to Money Supply: The M1 money supply consists of currency and checkable deposits. The U.S. 

government currently holds 286.9 million ounces of gold. If the government were to make each dollar redeemable 

by the amount of gold it possesses, we’d arrive at the following price for gold: $1.569 trillion ÷ 286.9 

million oz. = $5,468.80 per ounce.

Gold/Dow Ratio: The ratio was about “1” when gold peaked in 1980, meaning the Dow and gold were the same 

price. To restore that relationship at today’s stock prices would mean when the Dow is at 6,626, gold should 

be at $6,626/oz. Of course, we think it likely that the Dow will get a lot lower before gold peaks. But even 

if it drops all the way to 4,000, that would imply a gold price of $4,000/oz.

All the Money in the World vs. Gold Reserves: If the public eventually sees the paper game being run by the 

central banks for what it is, governments will be forced to back their currencies with gold (and perhaps other 

tangibles like silver). Assuming they had to go into the market and buy the gold needed to restore faith in 

their currencies, the numbers might look like this: Total central banks reserves (including gold holdings) = 

$4.8 trillion, divided by 929.6 million ounces total gold reserves held by all official institutions that 

issue currency = $5,246 gold price.

U.S. Gold Holdings to U.S. Foreign Trade Deficit: The size of a country's deficit or surplus would be of no 

consequence if all currencies were convertible into a fixed amount of gold. However, the dollar is 

increasingly considered a hot potato, and when the trade balance reverses, as it must, dollars will flow back 

to the U.S. and fuel domestic price inflation. Based on the cumulative trade deficit of $9.13 trillion (up 

from $6 trillion since June ‘07!) and U.S. gold holdings of 286.9 million ounces, the corresponding price of 

gold would be $31,822 per ounce.

U.S. Gold to U.S. Government Liabilities: Finally, the GAO (Government Accountability Office) calculates an 

income statement and balance sheet for the U.S. government. As you’d suspect, it is dominated by future 

liabilities for Medicare and Social Security. What if they had to be backed by the supply of gold? Official 

U.S. government liabilities now ring in at an incredible $55.2 trillion. To make good on that would require a 

$192,401 gold price.

No, we don’t think gold will hit $192,000 or even $32,000. And there really isn’t any surefire way to forecast 

the eventual high. But it’s clear that every weathervane is pointing in the same direction. So, yes, gold 

isn’t going to $2,000; it’s going higher.

Witness the Breakdown

When determining how to keep your wealth safe, the state of global affairs can be a powerful reminder that 

gold should be part of the strategy. And today our world, essentially, is on fire.

Eastern Europe borders on bankruptcy. Brazil's economy is falling off a cliff. Ditto Mexico.


Protests have erupted in Latvia, Chile, Greece, Bulgaria, Iceland, Dublin, and parts of the U.S. Workers have 

gone on strike in Britain and France.


In the U.S., 36 states and the District of Columbia have proposed or implemented reductions in the civil 

workforce. (You think customer service is poor now...)


An astounding one in nine homes, 14 million, sits empty in the U.S. The December median price of a home sold 

in Detroit was $7,500. More than 8.3 million homeowners were upside down on their mortgage in the fourth 

quarter. Freddie Mac's new CEO resigned after six months on the job.


Last quarter, 12 U.S. banks failed, bringing the 2008 total to 25, the highest one-year death rate since 50 

failed in 1993. More foreboding, another 252 banks joined the FDIC’s “problem list.” So far this year, 19 

banks have failed.


The central bank of Ukraine banned the early redemption of term deposits, the most popular form of savings in 

the country. Bank deposits have dropped 20% since September, as bank customers dodge the risk of getting 

locked in.


The projected US$1.75 trillion federal budget deficit is almost four times the nation’s previous record-high 

budget deficit. The Times Square debt clock reads over $11 trillion. Japan’s now reads $7.8 trillion.


High unemployment has become a worldwide epidemic, with the infection spreading.
With world economies taking it on the chin, it’s little wonder that investor interest in gold as a safe haven 

is growing – a trend we expect to continue. And just wait until the dollar resumes its slide, the expanding 

money supply jolts the real economy, and inflation kicks in.

Both Hands on the Wheel

Given the ongoing turmoil and the swallowing darkness at the end of the crumbling economic tunnel, our 

recommended BIG GOLD strategy remains keeping one-third in cash, one-third in physical gold, and one-third in 

our selected gold stocks. New money for investment should be split among the same three categories; we just 

don’t see any safer places to be.

As economies around the world continue to shrink and governments continue administering larger doses of the 

wrong medicine, we’ll sit in relative comfort with our gold for protection and our stocks for profit. We 

expect the prices of both to rise as others join us.

Even though some of the mainstream media are already popping the champagne, cheerfully pronouncing the end of 

the crisis, we beg to differ. The economic quagmire the U.S. and much of the developed world is in is far from 

over… so be right and sit tight, as we at Casey Research like to say.
BLOG ALL ABOUT

I will make an effort to post on economics,finance,art, cars and markets at least once 24/7, no promises.  For a variety of reasons, I may be unable to maintain this schedule, please bear with me. If unable to comply, I will post periodically when an issue of particular interest arises.

Sunday Times Rich List 2009


Sunday Times Rich List 2009: Bonfire of the billionaires wipes out £155bn fortune

From 
April 26, 2009

THE recession has wiped £155 billion from the fortunes of Britain’s richest 1,000 people, equivalent to more than a third of their wealth.

The unprecedented collapse, revealed in the 2009 Sunday Times Rich List, published today, is the biggest annual fall since it was first compiled 21 years ago.

In a bonfire of the billionaires, the number in this year’s Rich List has fallen from 75 to 43. Between them, people ranked in the top 100 lost £92 billion. Only three saw their wealth increase.

As the not-so-rich complain about tax rises announced in the budget, new figures this weekend suggest the government will have to introduce even higher taxes that will further deplete their fortunes.

Economists have calculated that public spending in Britain is set to rise to more than 50% of national income, more than when the Labour government had to be bailed out by the International Monetary Fund in the 1970s.

Analysis of the small print of the budget also revealed that the government will need to find an extra £1.1 billion to pay the pensions of retired civil servants and other state workers over the next two years. The cost of providing such final salary schemes will have doubled to £4.6 billion by 2011 in just three years.

The Rich List’s biggest loser, Lakshmi Mittal, has seen £16.9 billion evaporate from the collapse of the world steel market this year. Now worth £10.8 billion, Mittal remains the richest person in Britain.

He has sustained losses of more than three times the level of Roman Abramovich, his nearest rival in the downshifting stakes, who was down £4.7 billion. The Russian’s surviving £7 billion makes him the second richest person in the UK.

The Duke of Westminster is the richest Briton and continues to occupy third position overall with a fortune of £6.5 billion. The duke’s property assets, centred on Mayfair and Belgravia in London, have shrunk more slowly than others, losing £500m in value. Thirty-eight people in the Rich List have lost in excess of this amount.

While some billionaires have slipped into mere millionaire status, others have disappeared from the list altogether. Sir Tom Hunter, worth £1.05 billion last year, has seen his investments in housebuilding, garden centres and retail turn sour. Coupled with his pledge to give his fortune away — he has donated £23.3m in the past year — Hunter no longer makes the Rich List.

Over the past five years the bottom line required for a place in the Rich List has risen from £30m in 2003 to £80m last year. Now a fortune of £55m is sufficient to make the top 1,000.

The Rich List’s combined wealth adds up to £258.27 billion, compared with £412.8 billion last year.

Faced with such harsh economic conditions, the business community has reacted badly to Alistair Darling’s budget announcement of a 50p top rate of tax. Two well known entrepreneurs have today announced their intention to leave Britain as a result.

Hugh Osmond, whose business interests span insurance to pub groups, said he was moving to Switzerland. Peter Hargreaves, who co-founded Britain’s biggest firm of financial advisers, has said that he is planning to leave for Monaco or the Isle of Man.

Tim Waterstone, founder of the Waterstone’s bookshop chain and a former Labour donor, attacked the 50p tax as a “spiteful political move” and described it as a “disincentive to entrepreneurs”.

There is speculation that Labour may lose many of the well-heeled donors it attracted during the so-called “prawn cocktail” offensive of the mid-1990s, when many City types pledged money and support to the party.

Derek Tullet, the City businessman and Labour supporter, said he would not have changed tax rates. “The problem is it is a disincentive to working here and we don’t want disincentives at this time. I think we will lose people as a result,” he said.

In last week’s budget Darling said the size of the state would peak at 48.1% of gross domestic product next year, its highest since the early 1980s. But calculations by economists for the Policy Exchange think tank, using the IMF’s growth forecasts rather than the Treasury’s, show a rise to more than 50%, exceeding the 49.7% crisis level under Denis Healey in 1976.

“We are heading for a frightening situation where the government controls the majority of our national income,” said Neil O’Brien, the director of Policy Exchange.

“All the evidence suggests that this will be very bad for growth and jobs and we run the risk of a crisis. Public spending must be reduced as quickly as possible to put us back on a sustainable path.”

A Treasury spokesman said: “The government’s long-term liabilities, including pensions, are fully affordable each year now and into the future.”

12 Reasons To Be (Economically) Optimistic

12 Reasons To Be (Economically) Optimistic
APRIL 29, 2009, 8:44 AM ET   wsj.com

By David Wessel

Ed Yardeni, the loquacious economist offers a dozen happy thoughts about the economy “while we are waiting to see how the swine flu pandemic plays out.”

His list, distributed in his daily email to clients:

(1) In the U.S., consumer confidence rebounded during April.
(2) The percentage of consumers who say that jobs are hard to get edged down in April after rising thirteen of the previous fourteen months. This tends to confirm the recent downticks in weekly initial unemployment claims.
(3) The home price story isn’t all bad news recently. Indeed, after more than a year and a half of declines, California’s median home price finally managed a meager gain, rising 2.2% month over month.
(4) Corning is bringing back some laid off workers on stronger-than-expected demand for glass used in making flat-screen televisions.
(5) Sharp is forecasting a strong recovery in profits and sales in all its business divisions during the second half of the year.
(6) IBM said Tuesday that it will increase its quarterly dividend by 10% and will repurchase an additional $3bn of its stock.
(7) The 4/28 Financial Times reported that the high yield bond market may be starting to open up again. About $7 billion was raised in April, the highest volume since last July.
(8) The stock market held up remarkably well on Monday and Tuesday despite nervousness over bank stress tests, swine flu, and the forced downsizing of the U.S. auto industry.
(9) The first quarter earnings season is off to a good start as 64% of the 235 S&P 500 companies reporting so far have a positive surprise and all 10 sectors are beating their first-quarter forecast too.
(10) Our Fundamental Stock Market Index rose during the week of August 18 as jobless claims edged lower and the Consumer Comfort Index moved higher.
(11) Condé Nast has decided to shutter Portfolio after two years of struggle. The introduction of the glitzy magazine about Wall Street launched in the spring of 2007 marked the end of the bull market. Now its demise may mark the end of the bear market.
(12) Confidence in the Euro Zone rose in April from a record low in March. The European Commission’s economic sentiment indicator jumped up to 67.2, from a revised 64.7 in March, but remains well below its long-term average of 100. Households and firms are less pessimistic about the outlook.

Economists React: ‘Obvious Glimmers of Hope’ in GDP APRIL 29, 2009, 10:25 AM ET WSJ.com

 By Phil Izzo

Economists and others weigh in on the worse-than-expected decline in gross domestic product.

  • The bottom line of this report is simply that the U.S. economy remains rather weak as the ongoing housing correction and financial sector crisis continue to weigh heavily on the domestic economy. However, there were some obvious glimmers of hope in the report as the improvement in consumer spending (which remains the lynch-pin of U.S. economic activity) during the quarter suggests that U.S. household spending may be on the rebound. Also of note is the fact that the massive draw-down in inventory may mean that this component could add favorably to output in the near future. –Millan L. B. Mulraine, TD Securities
  • The downward momentum continued into the first quarter. However, the economy was not as soft as the GDP number indicated. Businesses stopped producing goods for a while slashing inventories by a whopping $104 billion. Without the inventory runoff, the economy would have contracted by 3.4% instead of 6.1% as reported. This is good news. With lean inventories, production will be cranked up in order to restock the depleted shelves in coming months. –Sung Won Sohn, Smith School of Business and Economics
  • Consumers came out guns a’blazin, but even that wasn’t enough to overcome the downward pressure of the corporate sector. Personal consumption expanded at a surprisingly robust 2.2%, on the combined strength of greater demand for both durable and non-durable goods. This result stands in stark contrast to talk — including that from yours truly — of diminished credit availability leading to lower consumer demand. Still, the first-quarter consumer performance is likely a matter of a bounce from low late 2008 levels, and with a savings rate in the 4% range, significant consumption growth will remain a long run challenge for the domestic economy. –Guy LeBas, Janney Montgomery Scott
  • The upside surprise in first-quarter consumption largely reflected higher then anticipated spending on services. This will show up as either an unusually sharp gain in March and/or an upward revision to Jan/Feb when the monthly breakdown is released tomorrow as part of the personal income report. From a broader perspective, the modest rebound in first-quarter consumer spending following back to back declines in the second half of 2008, was driven by the upside surprises in the previously reported results for retail control in January and February. However, given the significant fall-off that was seen in March retail control, the ramp points to a renewed decline in consumer spending in second quarter. –David Greenlaw, Morgan Stanley
  • This is nothing to celebrate, and simply indicates that the recession will be longer and deeper than most economists expect. With the collapse of the housing and stock markets, the surge in unemployment, and the fall in wages, the only way that consumers can spend more is if they reduce savings or increase borrowing. However, our economy collapsed precisely because we borrowed and spent too much to begin with. The economy will not find a solid foundation unless consumers decide to live within their means. Sadly that message is not getting out. –Peter Schiff, Euro Pacific Capital
  • On the surface, 2009’s first quarter doesn’t look much different than did 2008’s fourth quarter, as real GDP contracted at an annualized rate of 6.1% in the first quarter after contracting by 6.3% (annualized) during 2008’s final stanza. The details, however, of the GDP data in the respective quarters are markedly different, and despite the dismal headline number, the details of the first-quarter report suggest a much smaller contraction, if not a modest advance, in real GDP during the second quarter. This should not, however, be taken as a sign that the recession has run its course. Clearly this is not the case, and there are plenty of downside risks still facing the U.S. and global economies. –Richard F. Moody, Forward Capital
  • The broad picture of the economy painted by this report makes sense. The output declines in terms of real GDP were almost as severe in the first quarter as that seen in the fourth quarter (private sector hours worked would have suggested a larger decline — productivity continues to hold up well in the recession), however the declines in both final demand and nominal GDP were much less severe. The baton of demand declines was passed firmly from the consumer to the producer. –RDQ Economics
  • Arguably the most negative feature of this report was the unprecedented 37.8% plunge in business fixed investment. That decline underscores the lagged feedback effect of the collapse in consumer spending during the second half of last year. If consumer spending stabilizes, a stabilization in capital spending would further improve the near term outlook. –Nomura Global Economics
  • The downside surprise to our -3% forecast is almost all in capital spending on equipment and nonresidential structures, down 33.8% and 44.2% respectively, and government spending, down by 3.9%… The capital expenditure numbers are hard to square with the monthly data, and we think there is scope for upward revision… Overall, horrible. The second quarter will be less bad. –Ian Shepherdson, High Frequency Economics
  • Surprising was a -0.35 percentage point contribution from federal defense spending and little change in federal nondefense spending. Presumably, federal spending will boom in coming quarters as fiscal stimulus begins to manifest itself. However, with the budget positions of states and localities suffering (-0.49 percentage point contribution from state and local government spending to overall GDP growth in first quarter following -0.25 percentage point in the fourth quarter), a good chunk of the stimulus is merely going to blunt declines in those categories of spending. –Joshua Shapiro, MFR Inc.

JPMorgan: Upbeat on the Economy May 1st, 2009

May 1st, 2009 3:12 pm

What follows is a note from JPMorgan economists to clients in which they revise upward their GDP forecasts:

In what feels like the first time since the Babylonian era, we are making
an upward revision to our US GDP forecast. The attached table provides
details of a forecast which now has GDP gains at -0.5, 1, 2, 3,4 percent
over the four quarters beginning in 2Q09. We would not place too much
emphasis on the point estimates which move in a smooth step-wise fashion.
Instead, we would emphasize two key contours of the forecast. First, we are
looking for the recession to end around midyear. This stabilization in
growth comes as forces that have weighed significantly on GDP growth in
recent quarters — housing, consumer durable spending, inventories and
government spending — either add to growth or become significantly smaller
negatives (housing). This improvement is expected to offset continued large
drags from business spending, employment and exports. Second, we are
looking for this consolidation to give way to strong growth as we turn into
2010 where we now expect GDP to rise 3.6% (q4/q4).

In making these changes we recognize that activity data has not
significantly surprised to the upside of our existing forecast. Instead, we
are making changes based on three other considerations.

– The quick improvement taking place in Asia and in Emerging Market economies, which increases the likelihood that a synchronized turn in global growth will take hold in 2H09.

– The positive feedback loop emerging between better economic news,
improving financial market conditions, and rising consumer confidence.

– Better than expected news from high-frequency readings that are key to
watch at turning points (ISM, jobless claims, auto and home sales). These
series have not moved decisively from depressed levels. But when they turn in a synchronized fashion they are usually signal that a more fundamental change in the business cycle is afoot.

At this stage we are not changing our unemployment rate or inflation
forecast. As such, our Fed policy call is also unchanged

Saturday, May 2, 2009

Buffett Dismisses Stress Tests, Praises Wells Fargo

Buffett Dismisses Stress Tests, Praises Wells Fargo  

By Erik Holm, Betty Liu and Andrew Frye

May 2 (Bloomberg) -- Berkshire Hathaway Inc. Chairman Warren Buffettdismissed the importance of government stress tests in helping him assess banks, and said Wells Fargo & Co. will prosper no matter what the results show.

“I think I know their future, frankly, better than somebody that comes in to take a look,” Buffett today said of the bank stocks that Omaha, Nebraska-based Berkshire owns. Regulators “may be using more of a checklist-type approach.”

The stress tests are designed to show whether the banks need more capital to withstand a deterioration of economic conditions, and results are expected to be disclosed on May 7, according to a government official familiar with the plan. Buffett said he instead judges banks by their “dynamism” and their ability to attract deposits, and singled out San Francisco-based Wells Fargo as a “fabulous” company.

“If you look at Coca-Cola today, for example, and just looked at a balance sheet, it wouldn’t tell you anything at all about Coca-Cola,” the billionaire investor said today in a Bloomberg Television interview before Berkshire’s annual meeting. “It’s what the product is.”

Wells Fargo is Berkshire’s second-largest holding by market value after Coca-Cola Co. and the biggest bank on the U.S. West Coast. Berkshire also owns stakes in Goldman Sachs Group Inc., Bank of America Corp., the biggest U.S. bank by assets, as well as U.S. Bancorp, M&T Bank Corp. and SunTrust Banks Inc. Buffett has praised Wells Fargo for gathering funds at a low cost and taking fewer lending risks than competitors.

Competitive Advantages

“All banks aren’t alike by a long shot, and in our view Wells Fargo, among the large banks, has some advantages the others do not,” Buffett said today at Berkshire’s annual meeting in Omaha, Nebraska.

Wells Fargo has declined 33 percent this year on the New York Stock Exchange on concern the bank will take losses on loans acquired with the purchase of Wachovia Corp. The bank slashed its dividend 85 percent in March, reducing investment income for Berkshire.

Wells Fargo stock closed at $19.61 yesterday after falling below $9 in March. Buffett said he was speaking to a class the day the shares dropped that low and told students that, at that price, “If I had to put all of my net worth into stock, that would be the stock.”

Buffett told shareholders today that he’d “love” to buy the entire bank or U.S. Bancorp and is unable to do so because Berkshire wouldn’t get permission from regulators.

Record Attendance

The annual meeting gives Buffett and Vice Chairman Charles Munger a platform to discuss markets, the economy and Berkshire’s businesses. A record 35,000 people filled Omaha’s Qwest Center arena, its overflow rooms and a ballroom at a hotel across the street as the two fielded questions concerning Buffett’s replacement, Berkshire’s investments and its derivative bets on the world’s stock markets.

Berkshire, with a U.S. stock portfolio of $51.9 billion, has been pressured as equity markets dropped and U.S. unemployment rose to its highest in 25 years. Berkshire shares have plunged 31 percent in the past 12 months, and profit has fallen in five-straight quarters through the end of 2008 on deteriorating results at insurance units and liabilities from the derivatives.

Buffett said today that first-quarter operating earnings fell to about $1.7 billion from $1.9 billion. The figure doesn’t count some investment results. Buffett is scheduled to release net income on May 8.

Back to Business

Known as the “Oracle of Omaha,” Buffett has grown into a cult figure among investors who admire him as much for his homespun aphorisms as for his stock-picking savvy. Some shareholders at today’s meeting rushed to the front rows of the arena as soon as the doors opened at 7 a.m., while others browsed booths in an adjacent exhibit hall where Berkshire units including See’s Candies and car insurer Geico Corp. hawk their wares.

The meeting, as in recent years, began with a movie in which Buffett hobnobbed with celebrities -- this year rebroadcasting clips that included actress Susan Lucci. Then Munger and Buffett took the stage for a five-hour question-and- answer session whose format was adjusted from past meetings.

The new arrangement, in which half the questions are pre- screened by reporters, was adopted after unscreened shareholder questions in prior years resulted in inquiries about baseball, abortion and Buffett’s personal relationship with Jesus Christ - - and few about Berkshire and its operations.

Buffett, Munger

Carol Loomis, the Fortune reporter who was one of the three journalists on the panel, said they received 5,000 proposed questions. Buffett instructed the panelists to ask questions only about Berkshire.

“I’ve been to about a dozen meetings, and this is probably the best one,” said a shareholder who was picked by lottery to ask an unscreened question. “Thanks for the new format.”

Buffett and Munger have used recent meetings to promote Berkshire as a buyer of non-U.S. businesses and distinguish their operations from what they consider the sometimes reckless behavior they see on Wall Street. Their pronouncements reach shareholders, potential customers and ratings firms.

Moody’s Investors Service and Fitch Ratings cut Berkshire’s top AAA credit rating in the last two months, a move that “has no economic impact” on Berkshire, Buffett said in the interview before the meeting began.

“It just doesn’t,” he said. “We don’t use borrowed money in any real significant sense. My pride may be wounded just a bit.”

To contact the reporters on this story: Erik Holm in Omaha ateholm2@bloomberg.net; Betty Liu in Omaha at bliu17@bloomberg.net;Andrew Frye in Omaha at afrye@bloomberg.net.

Last Updated: May 2, 2009 14:40 EDT 

Steven A Cohen's collection goes on show at Sotheby's

Steven A Cohen's collection goes on show at Sotheby's

Art collector Steven A Cohen exhibits some of his most prized possessions at Sotheby's, New York. But is the show just a vain attempt to stimulate the art market?

Detail from Van Goghs Portrait of a Young Peasant Girl, 1890
Van Gogh's Portrait of a Young Peasant Girl: Cohen acquired the painting for around $80 million

For someone who guards his privacy assiduously, the American hedge-fund billionaire Steven A Cohen has had his fair share of publicity. It was Cohen, for instance, who bought Damien Hirst's $12 million (£6.5 million) pickled shark four years ago and had to replace it because it was disintegrating. And it was Cohen, a year later, who was ready to buy a $139 million Picasso before its owner, the famously colour-blind Las Vegas hotelier Steve Wynn, inadvertently stuck his elbow into it.

Now, 52-year-old Cohen is in the limelight again as 20 paintings and sculptures of women from his collection with an estimated value of $450 million are on display, though not for sale, at Sotheby's in New York.

It is the first public glimpse into the largely unknown holdings of a secretive, very rich art lover who has been one of the most potent forces in the art market for a decade. Naturally the show has aroused intense curiosity about how much the works cost, where they had come from, and what Cohen's motives were for exhibiting them.

The son of a dress manufacturer, Cohen showed an aptitude for making money long before displaying an interest in art. In 1978, aged 22, he made an $8,000 profit on his first day trading options. In 1992 he formed his own company, SAC Capital, with $25 million under management and nine employees. By July last year, SAC had $14 billion under management and 800 employees, with Cohen ranked as America's 36th richest man, worth $8 billion.

His art collecting started with Impressionism, and a taste for the best money could buy. One of his first purchases was a self-portrait by Manet for which he paid $18.7 million in 1997, the second highest price for the artist.

The earliest purchases in the Sotheby's exhibition date from 2001 when he bought a famous Munch painting, Madonna, for a reported record $11 million from New York dealers Mitchell-Innes and Nash, and a Matisse bronze, Figure decoratif, from Sotheby's for $12.6 million, close to the record for a Matisse sculpture.

Turning to contemporary art, he compiled a breathless catalogue of stunning record prices – mostly paid privately. In 2004, he bought Francis Bacon's Study after Velázquez from the artist's estate for $16 million, sparking a dramatic surge in Bacon prices; Andy Warhol's Superman, from German playboy Gunther Sachs, for around $25 million; and a Jackson Pollock drip painting from Hollywood entertainment mogul David Geffen for $52 million.

Employing a team of specialist art advisors, Cohen targets private collections without waiting for auctions. Masterpieces in the Sotheby's show by Yves Klein from the collection of film director Claude Berri, and Gerhard Richter from Christie's owner François Pinault were both acquired this way.

In 2005, Cohen entered a truly purple patch when, following his acquisition of the Hirst shark, he acquired Van Gogh's Portrait of a Young Peasant Girl, on show at Sotheby's, for around $80 million from Steve Wynn. Then, in the run-up to the November 2006 auctions, he bought two de Kooning paintings from Geffen, including Woman III for $137.5 million. The prices were leaked to the press and the auction sales that month hit an all-time peak.

Recently, however, the hedge-fund industry has been rocked by the credit crisis. According to Forbes, Cohen's net worth was down to $5.5 billion last month, though SAC is no less aggressive in its financial dealings. Just as the Sotheby's exhibition was being organised, Cohen upped his stake in the company from 4.7 per cent to 5.9 per cent, making him Sotheby's third-largest shareholder. However, most experts believe he is not so much interested in owning the company as simply making a shrewd investment. Cohen clearly believes in Sotheby's ability to remain profitable during the downturn and in the longer-term prospects for the art market, and since upping his stake, Sotheby's share price has risen from $6 to $10.9.

But is the exhibition just a vain attempt to stimulate the market by reliving the art boom in the run-up to the all-important May sales in New York?

Certainly, it is effective PR for both Sotheby's and Cohen. But, as a show which is as inescapably about money as it is about art, it may fall between two stools. In his scathing Channel 4 programme The Mona Lisa Curse last year, Robert Hughes argued that successive art booms had made it difficult to look at art without thinking about how much it was worth. Now we are officially in a recession, the issue for those who are concerned about such things is to wonder how much less that art might now be worth.